GEOTECHNICAL ENGINEERING
NASHVILLE
HomeGeophysicsSeismic tomography (refraction/reflection)

Seismic Tomography Surveys in Nashville: Subsurface Imaging for Smart Foundation Decisions

Practical geotechnics, field-tested.

LEARN MORE

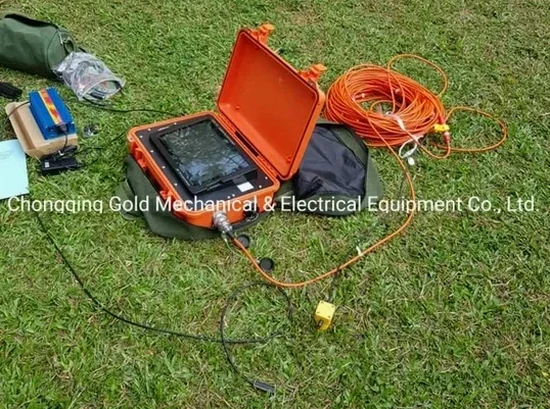
The most expensive mistake we see in Nashville is guessing bedrock depth. A contractor sinks a budget for deep foundations, only to hit limestone 8 feet down. Or worse—assumes shallow rock and discovers a 30-foot paleochannel filled with soft alluvium. Both scenarios kill budgets. Seismic tomography eliminates this gamble. We deploy 24- or 48-channel arrays with a accelerated weight drop source. The energy travels through soil and rock at different velocities. Our geophones capture the arrivals. Inversion software builds a 2D velocity cross-section. You get a continuous image of the subsurface—not just a point from a boring. For projects near the Cumberland River or along the I-24 corridor, where alluvial deposits overlie Ordovician limestone, this method reveals the true stratigraphy. We often pair it with test pits to ground-truth velocity boundaries with visual inspection of the weathered rock interface.

A 2D velocity cross-section shows you what a boring log can miss: the dip of the rockhead, the width of a weathered zone, and the shape of a void.

Our service areas

Our approach and scope

Nashville's expansion since the 1990s has pushed development into terrain the old-timers avoided. Steep hillsides near Whites Creek. Karst plains in Donelson. The underlying Fort Payne and Ridley limestone formations were deposited 400 million years ago. They've been dissolving ever since. Solution cavities, pinnacled rock, and erratic epikarst are common. Our refraction surveys measure P-wave velocities that typically range from 400 m/s in residual clay to over 4,000 m/s in competent limestone. Reflection profiles image deeper structure—useful when a planned excavation approaches the water table or a suspected fault zone. We run the inversion with damped least-squares and check the RMS error on every shot gather. A clean profile lets you position an SPT drilling program exactly where it counts, reducing the total number of borings while improving confidence.
Seismic Tomography Surveys in Nashville: Subsurface Imaging for Smart Foundation Decisions
Technical reference — Nashville

Local ground factors

A site in Green Hills and a site in Antioch can look identical on a grading plan. But the subsurface tells a different story. Green Hills sits on thick, cherty residuum over moderately weathered limestone. Antioch, closer to Mill Creek, often has deep alluvial silts and a much more irregular bedrock surface. Seismic refraction in Green Hills typically shows a gradual velocity increase with depth. In Antioch, we often see a sharp velocity contrast at the soil-rock boundary—and sometimes a velocity reversal if loose sand sits below stiff clay. If you don't image this, your excavation plan is guesswork. The IBC and ASCE 7 require site-specific shear wave velocity profiles for Seismic Site Class determination. We derive Vs30 from MASW or downhole surveys, but the refraction tomography gives the stratigraphic context that explains the velocity profile. Missing a buried channel or a karst void can shift the site class and trigger a redesign.

Need a geotechnical assessment?

Reply within 24h.

Email: contact@geotechnicalengineering.biz

Regulatory framework

ASTM D5777 (Standard Guide for Using the Seismic Refraction Method for Subsurface Investigation), ASTM D7128 (Standard Guide for Using the Seismic-Reflection Method for Shallow Subsurface Investigation), IBC 2021 Section 1613 (Earthquake Loads—Site Classification), ASCE/SEI 7-22 Chapter 20 (Site Classification Procedure)

Reference parameters

ParameterTypical value
P-wave velocity in residual clay (typical)350–750 m/s
P-wave velocity in weathered limestone1,200–2,500 m/s
P-wave velocity in competent bedrock3,800–5,500 m/s
Maximum investigation depth (refraction, 115 m spread)30–40 m
Source type (standard)Accelerated weight drop or sledgehammer
Horizontal resolutionGeophone spacing / 2
ASTM standard for field procedureASTM D5777

Questions and answers

How deep can seismic refraction see in Nashville's karst terrain?

With a 115-meter spread and a good energy source, we typically image 30 to 40 meters deep. The actual depth depends on the velocity contrast and the presence of stiff clay above the bedrock. If the limestone is highly fractured or the clay is very stiff, the velocity contrast is weaker and the method resolves less. We assess this during the walkover survey before laying out the line.

What's the cost range for a seismic tomography survey in Nashville?

Most projects fall between US$2,620 and US$5,760, depending on line length, number of spreads, and whether we combine refraction with MASW or reflection. A single 115-meter refraction line with MASW at the center is at the lower end. Multiple lines, difficult access, or specialized reflection processing push toward the upper end.

Can seismic refraction detect sinkholes and voids?

It can detect velocity anomalies associated with voids—if the void is large enough relative to its depth and has a measurable velocity contrast with the surrounding rock. But no single geophysical method detects all karst features. We often recommend combining refraction tomography with electrical resistivity or ground-penetrating radar for a more complete karst assessment, then spot-checking anomalies with borings.

How long does a typical seismic survey take on site?

A single refraction spread with setup, shooting, and breakdown usually takes our crew one day. Data processing, first-arrival picking, and tomographic inversion add another two to three days in the office. You get the preliminary cross-section within a week. Larger multi-line surveys scale linearly—a three-line site is typically three field days plus a week of processing.

Location and service area

We serve projects in Nashville and surrounding areas.

View larger map